Final Write-up
Contributors
Equal work was performed by both project members.
- Tao Lin (tlin2@andrew.cmu.edu)
- Bowei Chen (boweic@andrew.cmu.edu)
Summary
We implemented a JavaScript framework for computing the layout for large-scale graphs in the web platform. We use the GLSL on WebGL to do general purpose computation for a force-directed graph layout algorithm.
Background
It is a common desire of data scientists and some artists to visualize, interact, and analyze large-scale graphs on a web platform. Honestly, running on browsers with JavaScript is not the most efficient platform to calculate the layout of large graphs, considering some great graph visualization software like Gephi. But browsers is a popular visualization platform because of the cost of deployment and maintenance and other business and engineering reasons (Why in the browser?). It would be fascinating if an end user could visualize and interactive with large-scale graphs by simply opening a web page without any installment or configuration.
Graph layout algorithms take a series of nodes’ coordinates and edges as input, iteratively update the position of each node. These algorithms execute for some iterations or until convergence.
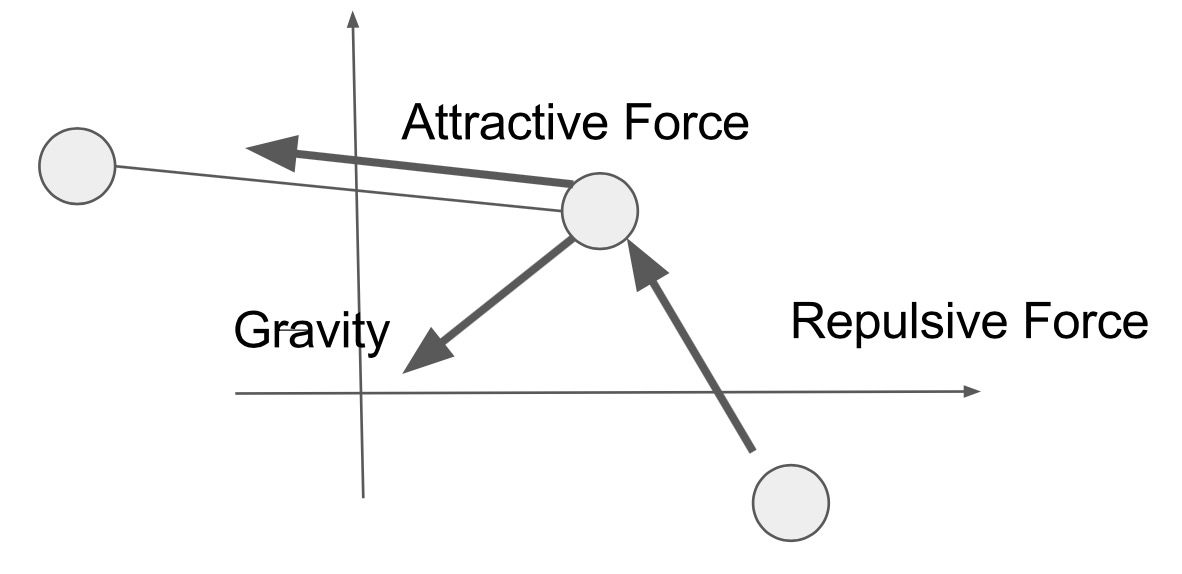
We currently utilize Fruchterman Reingold algorithm. In each iteration, each node applies three types of forces, repulsive force, attractive force and gravity, then update the X & Y coordination respectively. The repulsive force is applied to each pair of nodes to keep them from getting too close, the attractive force is applied to each edge to pull the source node and destination node towards each other and the gravity pull each node towards the origin, which prevents clusters from getting too far from each other. This computation is memory bound because the most time-consuming computation is when applying the repulsive force for each node which performs 10 float-point arithmetic operations on four 32-bit reads.

Since the computation between nodes is independent in each iteration and a large portion of the memory read can be sequential if we optimize the memory layout, the algorithm is extremely suitable for SPMD program that runs on GPU.
Approach
We utilize the interface of WebGL library to do general purpose computations on the layout, the renderer library is sigma.js, which is also based on WebGL. We take the idea of utilizing GPU for general purpose computation from GPGPUtility.js, but their framework doesn’t go quite well with our computation problem, so we did a lot of modifications to the library and at last the algorithm can run on GPU.
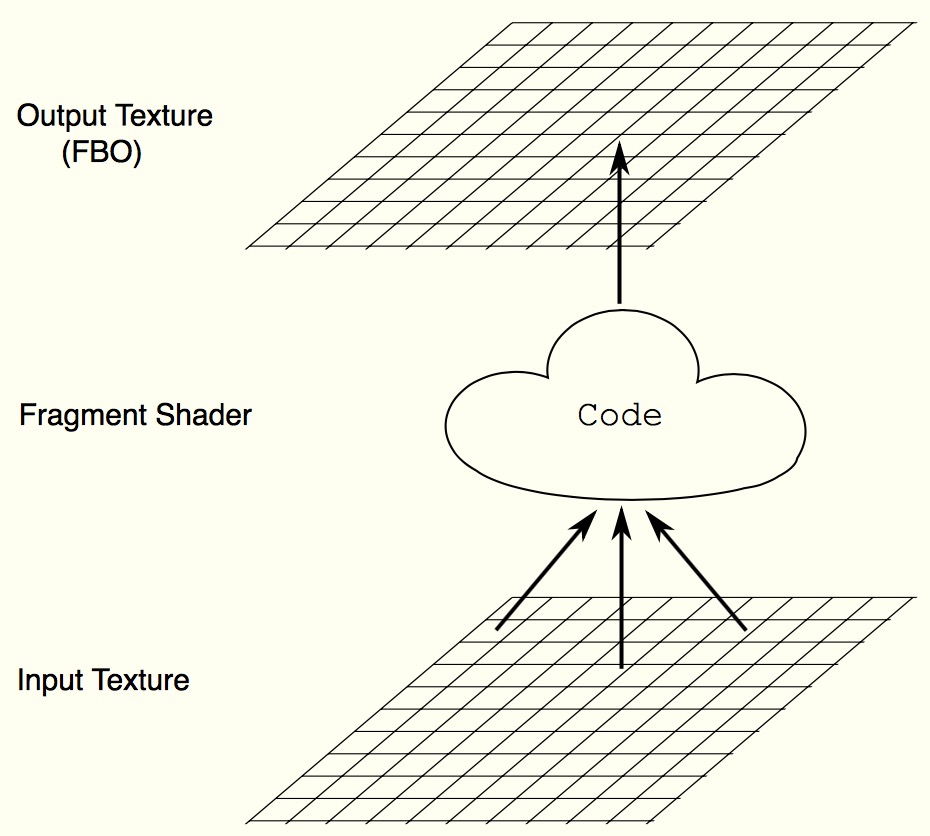
WebGL is not designed for general purpose computation, it’s a renderer library. It works as follow: in each iteration, a shader program takes an array of input pixels, performs computation and writes to an output pixel. To perform the computation of the layout algorithm, we need to design proper data structures and workflows under this computation framework.
 http://www.vizitsolutions.com/portfolio/webgl/gpgpu/index.html
Layout algorithms are iterative, in each iteration, we need to update the X & Y coordination for each node. We’re utilizing WebGL by generating a shader program for each node that takes the output of previous iteration’s computation as input and updates the X & Y coordination to the output pixel.
Another issue is that the memory is limited for the GPU in our laptops. We aim at generating graph layouts for graphs containing tens of thousands of nodes, so in order for the nodes and edges of the graph to fit into the memory of the GPU, we need to optimize the memory layout of the graph. Our optimized memory layout will be shown in several paragraphs.
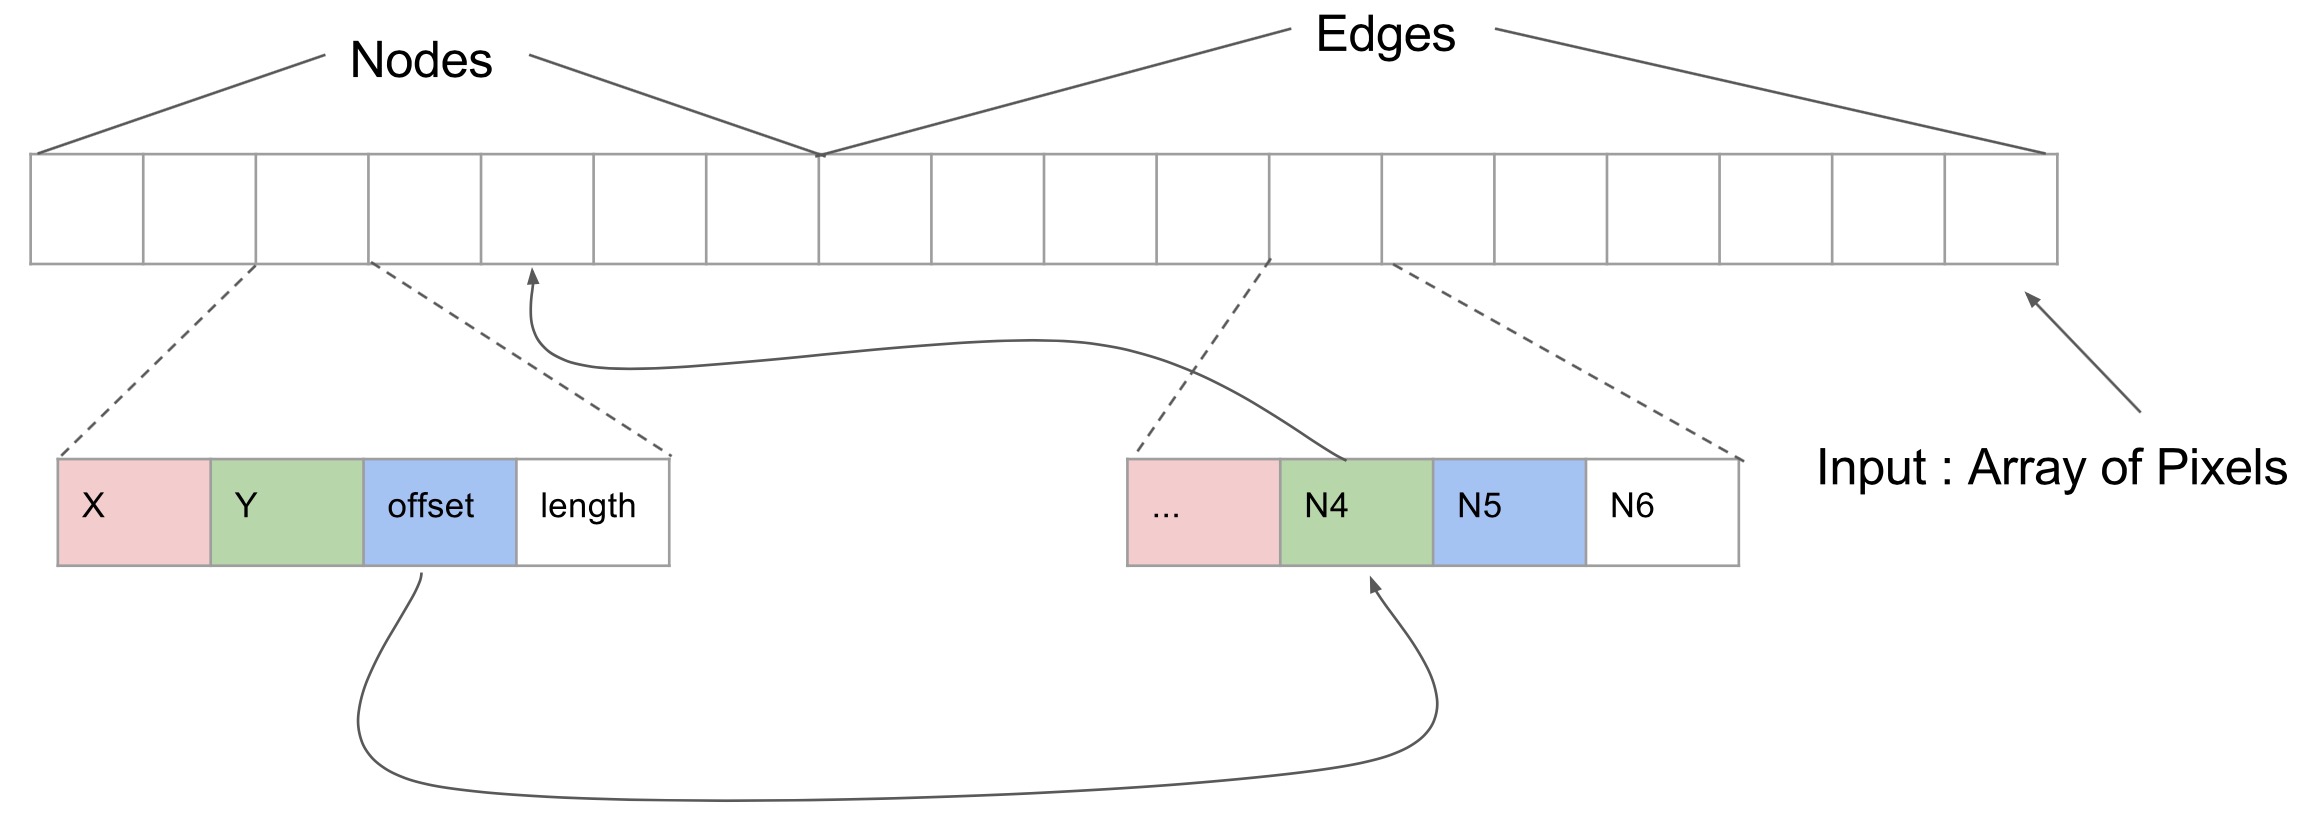
The memory layout is shown in the picture below. Each box in the array is a pixel that contains four 32-bit float which stands for r, g, b, and a. We pack the data structure for nodes together and store them at the beginning of the input array, each pixel stores a node’s data. Edges are following the nodes in the array. The edges for each node are stored together and placed in the array in the same order as the corresponding nodes. Each pixel for a node store the X & Y coordinations, the offset of the edges of the node in the array and the number of edges. Each edge only needs to store the destination node id, which is a 32-bit value.

This memory layout gives us several benefits. First, most of the memory access are sequential reads, and there’s little divergent execution. Because when we compute the repulsive force for different nodes, we access all other node’s data structure in the same sequential order. When we compute the attractive force for a node, the edge array for adjacent nodes are stored together in the array, we perform sequential read here for most of the time. We do random read-only when we need to access neighbor’s coordinates, but that’s infrequent compared to the sequential reads. Since the computation is memory bound, the design exploits data locality and thus provides us decent speedup.
The shader program for a target node first apply repulsive force from all nodes to the target node by iterating through the nodes in the input array. Then it reads the destinations of the target node’s edges and apply attractive forces from the destinations to the node. After that it applies gravity and compute the new X & Y coordinates and finally it write to the output texture.
Deliverables
Source Code
We implemented ParaGraphL as a layout plugin for Sigma. The source code is sigma.layout.paragraphl.js.
APIs
Configure
Change the configuration of the layout. Send the data of the graph as a Sigma object sigInst. Configure iterations in config.
sigma.layouts.paragraphl.configure(sigInst, config);
Start
Start the layout algorithm.
sigma.layouts.paragraphl.start(sigInst, config);
Example
See demo.html for an example of using ParaGraphL.
Demo and Results
We have achieved significant speedup, compared to an implementation without WebGL on Fruchterman Reingold graph layout algorithm. To our knowledge, we are the first one who implements graph layout algorithms with WebGL.
The baseline is an implementation of Fruchterman Reingold layout algorithm provided by Sigma.js. It is a popular JavaScript library dedicated to graph visualization. It does not use GPU to calculate the layout. Our version uses the same algorithm and configurations to make a fair comparison.
The dataset we use is a collaboration network of authors on arXiv. We sample it to graphs with different numbers of edges for testing.
Here is a quick demo for you to play around. It uses a graph with 10000 edges and 3285 nodes. It has 100 iterations before outputting the result. Typically, ParaGraphL (click me for demo) is faster than the baseline (click me for demo), if WebGL is enabled in your browser.
We benchmark the results on a MabBook Air. The CPU is 1.6GHz dual-core Intel Core i5. The GPU is Intel HD Graphics 6000. Yes, an integrated graphics card also works. The browser we use is Google Chrome 58.0.3029.96 (64-bit). To be accurate, we run each experiment five times and take the average.
We first tested the speedup on graphs with different numbers of edges, to see if it scales to large graph or not. Here are the results:
The results are generated after 100 iterations. The chart shows that ParaGraphL (red line) takes less time than the baseline (blue line), especially when the graph is large.
For a graph with 1,000 edges, it only takes ParaGraphL 106 ms to do all 100 iterations, which equals to 1.1 ms/frame. For a larger graph with 23,000 edges, it takes 1 second for 100 iterations, which is 12 ms/frame.
The gold line shows the speedup of ParaGraphL compared to the baseline. The speedup increases when the graph get larger because it can exploit more parallelism on large graphs. It can reach 489x speedup on a graph with 10,000 edges.
We also tested the speedup on different numbers of iterations. Here are the results:
It mainly shows the speedup of ParaGraphL increases when the iteration is larger. This is mainly because, in ParaGraphL, the overhead of the initialization before iterations is significant compared to the workload of each iteration. During the initialization, it builds the first texture with the data of the graph and sends data from CPU to GPU.
The original data of two charts above could be viewed at Google Sheets.
The layouts generated by these tests are showed below.
During the development, we have also tried some other optimizations which turn out do not help.
We once considered that it might be a good idea to sort the vertices by their edge counts before copying data into the input array. Because vertices with similar numbers of edges have better chances to be in the same block, thus divergent execution when applying the attractive forces can be reduced. But it turns out to be slower. We conclude that the reason is twofold.
The first reason is that the execution time on GPU side is spent mainly on applying repulsive forces so reducing the divergent execution in the process of applying attractive forces cannot result in notable speedup, which reflects Amdahl’s law.
Another reason is that the overhead of sorting and keeping an extra mapping between the CPU side node id and GPU side node id makes the Javascript code to slow down.
But we find it is interesting to mention this optimization experience, during which we put ideas ( divergent execution, Amdahl’s law, communication overhead, etc.) from the course into practice. We also learned that sophisticated design is not always better, and experiment is the best judger.
References
- Gibson, Helen, Joe Faith, and Paul Vickers. “A survey of two-dimensional graph layout techniques for information visualisation.” Information visualization 12.3-4 (2013): 324-357.
- Godiyal, Apeksha, et al. “Rapid multipole graph drawing on the GPU.” International Symposium on Graph Drawing. Springer Berlin Heidelberg, 2008.
- Buck, Ian, et al. “Brook for GPUs: stream computing on graphics hardware.” ACM Transactions on Graphics (TOG). Vol. 23. No. 3. ACM, 2004.
- Large-scale Graph Visualisations in the Browser
- Unleash Your Inner Supercomputer: Your Guide to GPGPU with WebGL Some other references are cited by the hyperlink where they are mentioned.