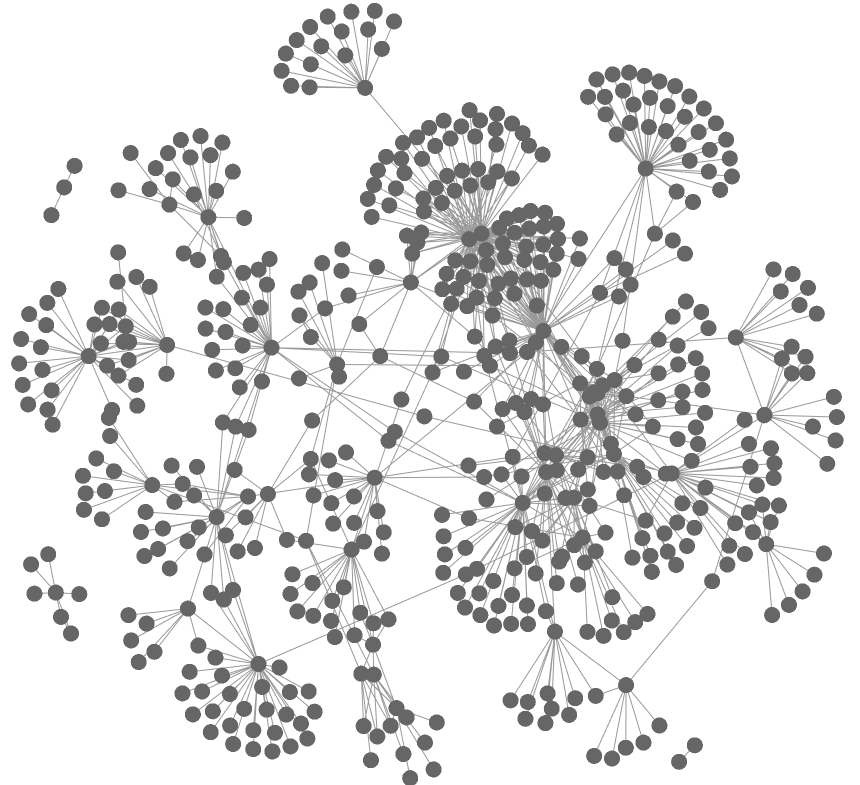
Preliminary Write-up
We implemented a JavaScript framework for calculating the layout for large-scale graphs in the web platform. We use the GLSL on WebGL to do general purpose computation for the graph layout algorithm.
This is a significant feature for data scientists, artists, and journalists, who would love to visualize and analysis large-scale graph efficiently in an interactive manner. They want to access it across all platforms by just opening a web page, instead of installing a software like Gephi.
Major Technical Challenges
- WebGL is not designed for general computing. Especially, it does not support fine-grained scheduling assignment like CUDA. We hacked to transform our problem to a graphics problem.
- GLSL in WebGL is in an older version than OpenGL. It does not support features like atomic add, compare and swap.
- Computing resources like texture size (used as a shared memory) is limited by software and/or hardware.
- GPGPU libraries we proposed before (like turbo.js) doesn’t work well. We finally had to deal with complicated WebGL APIs by ourselves.
Preliminary Result
We have achieved significant speedup, compared to an implementation without WebGL on Fruchterman Reingold graph layout algorithm. To our knowledge, we are the first one who implements graph layout algorithms with WebGL.
We test the program multiple times on a graph with 100, 500, 1000 edges and get the average runtime. The error is within 3%. We could achieve about 32x speedup for the layout of a graph with 500 edges in 10000 iterations on New MacBook. Furthermore, we get 75x speedup for a graph with 1000 edges in 10000 iterations.
Plan for Friday
- A cool live demo for visualizing a large-scale graph on a web page (It could be more exciting to show this by providing a short URL and let everyone present view on their laptops)
- A speedup benchmark graph like the one shows above. It would be an even better speedup since we will apply more optimizations before Friday.
FAQ
What is the baseline that speedup is being compared against?
The baseline is an implementation of Fruchterman Reingold layout algorithm provided by Sigma.js (a popular JavaScript library dedicated to graph visualization). It does not use GPU to calculate the layout. Our version uses the same algorithm and configurations to make a fair comparison.
Force-directed layout algorithms need to be interactive to be useful. What are the milis-er-frame times for your graphs?
For a graph with 2092 nodes and 5000 edges, it takes 1830 ms to finish 1000 iterations, on a Macbook Air. That’s to say, calculating the layout of each frame takes only 1.83 ms. (In the current setting, we only render after finishing all iterations. We will invoke rendering more frequently to have a more interactive manner.)
We’ll want to know a very brief description of the workload characteristics of the algorithm.
In one iteration, each node will compute a repulsive force by accessing the positions of all other nodes, and an attractive force by accessing the positions of connected nodes, and then add gravity and speed to get a new position. Approximately, it has about 10 float points operations every 16 bytes memory access. I would consider the workload as memory intensive.
Hopefully you can demo on some real-world graphs?
The graphs we used in the benchmark are sampled from a collaboration network of authors on arXiv:
